For the complete documentation index, see llms.txt. Markdown versions of all docs pages are available by appending .md to any docs URL.
Debug your setup
Debug your agentgateway environment.
Inspect and troubleshoot agentgateway proxies through the admin endpoints and the agctl command-line tool.
Admin endpoints
Each agentgateway pod runs an admin server on port 15000. The admin server provides the following endpoints for inspection and debugging.
| Endpoint | Description |
|---|---|
/config_dump | Returns the runtime configuration that the proxy has loaded, including binds, listeners, routes, backends, workloads, services, and policies. |
/debug/trace | Streams a JSON-over-SSE trace of the next request that the proxy handles. The agctl proxy trace command consumes this endpoint. |
/logging | Get and set the logging level at runtime. |
/memory | Dump allocator and process memory statistics. |
/debug/pprof/profile | Build a CPU profile by using the pprof profiler. Use ?seconds=N to set the duration (1–300s, default 10s) and ?frequency=N to set the sampling rate in Hz (1–1000, default 100). |
/debug/pprof/heap | Collect heap profiling data. |
/debug/tasks | Inspect the live tokio task tree. |
/quitquitquit | Trigger a graceful shutdown of the proxy. |
To inspect the configuration that a gateway proxy has loaded and to capture per-request traces, use the agctl command-line tool. agctl resolves the proxy pod for you, opens a port-forward, and renders the admin output in formats that are easier to scan than raw JSON.
Before you begin
Check the gateway, route, and policy status
Most routing and policy issues surface in the status of the corresponding Kubernetes resource. Check these first.
Verify that the agentgateway control plane and proxy pods are running.
kubectl get pods -n <namespace>Verify the Gateway is
AcceptedandProgrammed.kubectl get gateway -A kubectl get gateway <name> -n <namespace> -o yamlCheck the HTTPRoute for
AcceptedandResolvedRefsconditions.kubectl get httproute -Akubectl get httproute <name> -n <namespace> -o yamlCommon issues to check for:
- The wrong backend is selected.
- The wrong parent Gateway is referenced.
- Multiple HTTPRoutes conflict by having identical matchers or by having no matchers (and so default to
/).
Check AgentgatewayBackend and AgentgatewayPolicy resources for partial acceptance. A resource can report
Accepted=Truewithreason: PartiallyValidwhen the controller keeps the usable parts of a backend or policy and reports the invalid part in the condition message.Find the backends and policies that report
PartiallyValid. TheACCEPTEDcolumn ofkubectl getshowsTruefor these resources, so filter on the reason instead.kubectl get AgentgatewayBackend -A -o json | jq -r '.items[] | .metadata as $m | .status.conditions[]? | select(.type == "Accepted" and .reason == "PartiallyValid") | "\($m.namespace)/\($m.name): \(.message)"' kubectl get AgentgatewayPolicy -A -o json | jq -r '.items[] | .metadata as $m | .status.ancestors[]?.conditions[]? | select(.type == "Accepted" and .reason == "PartiallyValid") | "\($m.namespace)/\($m.name): \(.message)"'Inspect the resource that you want to debug, such as the
openaibackend in the following example.kubectl get AgentgatewayBackend openai -n agentgateway-system -o yamlFind the
Acceptedcondition in the output. For a backend, look instatus.conditions. For a policy, look instatus.ancestors[].conditions, which has one entry per Gateway that the policy attaches to.Example output:
status:
  conditions:
  - type: Accepted
    status: "True"
    reason: PartiallyValid
    message: 'failed to translate backend: secret agentgateway-system/openai-secret not found'
    observedGeneration: 1
    lastTransitionTime: "2026-09-21T14:02:28Z"
Read the
reason, not only thestatus. A check that tests theAcceptedstatus alone passes in this state because the status staysTrue. When the reason isPartiallyValid, the message names the configuration that could not be translated.Fix the cause that the message names. The rest of the resource is still translated and served, so the symptom usually shows up at request time instead of at apply time.
Invalid part What the proxy loads instead How to fix it The Secret that holds LLM provider credentials does not exist The backend keeps the credential field, but empty. Provider calls go out unauthenticated, so the failure comes back from the provider rather than from agentgateway. Create the Secret in the namespace that secretRefnames or correct the reference.A prompt guard webhook.backendRefnames a Service that does not existThe webhook stays in the policy with no target to call. Guarded requests then take the webhook failureMode, which isFailClosedunless you set it. WithFailOpen, prompt guarding is skipped instead.Create the Service or point backendRefat one that exists.A remote JWKS is not available yet The authentication policy keeps an empty key set, {"keys":[]}, so the policy trusts no keys. JWT authentication defaults toStrictmode, which rejects a request that carries no token and rejects any token that does arrive because no key can verify a signature.Check that the JWKS endpoint is reachable from the control plane. The controller retries the fetch with a backoff and installs the keys when it succeeds. A CEL expression does not compile The rest of the policy is kept and the expression is replaced with one that always fails. An authorizationrule that depends on that replacement therefore allows nothing.Fix the expression. The condition message names the field, then the expression that did not compile. Check the condition again. The controller recomputes it on its own when the missing Secret, Service, or key set appears, so you do not need to reapply the resource.
Inspect the loaded configuration
Sometimes a route is Accepted but the proxy still does not behave as expected. To see what the proxy actually loaded, dump its runtime configuration.
Render a summary of the routes, backends, and policies that the gateway has loaded.
agctl proxy config all gateway/<gateway-name> -n <namespace> -o yamlInspect the backends that the gateway is sending traffic to and their endpoint health.
agctl proxy config backends gateway/<gateway-name> -n <namespace>Example output:
TYPE     NAME       NAMESPACE            ENDPOINT                    HEALTH  REQUESTS  LATENCY
Backend  openai     agentgateway-system  backend                     1.00    1         4682.37ms
Service  ext-authz  backend-extauth      ext-authz-7c7596b5f6-tvs28  0.70    4         0.00ms
Service  httpbin    backend-extauth      httpbin-7dc88b5fbc-zqrfn    1.00    2         3.06ms
A backend or policy that reports
PartiallyValidstill appears here because the part of it that translated successfully is still served. Compare what the proxy loaded against the condition message from the previous section. For example, an authentication policy whose remote JSON Web Key Set (JWKS) was not available loads with an empty key set,{"keys":[]}.
For complete steps, see Inspect agentgateway configuration.
Trace requests
To see how a specific request flows through agentgateway, use agctl proxy trace. The trace shows you the route that was selected, the policies that were applied, the backend that was chosen, and the response status. Tracing helps you understand why a request did or did not match a route, why a policy was or was not applied, or why a request returned an unexpected status.
agctl proxy trace gateway/<gateway-name> -n <namespace> --port <listener-port> -- http://<host>/<path>agctl opens a port-forward to the proxy pod, captures the trace, sends the request, and renders the result in a text-based terminal user interface (TUI). Use --raw to print JSON Lines instead.
For complete steps, see Trace requests with agctl.
Enable debug logs
Agentgateway uses the same level syntax as RUST_LOG: error, warn, info, debug, and trace. Use agctl to read and change log levels at runtime for both the proxy and the controller. agctl resolves the pod and opens a port-forward for you, so you do not need to manage kubectl port-forward yourself.
Proxy logs
Show the proxy’s current log filter directive.
agctl proxy log gateway/<gateway-name> -n <namespace>Set the global log level for the proxy.
agctl proxy log gateway/agentgateway-proxy -n agentgateway-system --level debugExample output:
current log level is typespec_client_core::http::policies::logging=warn,hickory_server::server::server_future=off,rmcp=warn,debugTail the proxy logs to see the added detail.
kubectl logs -n <namespace> deploy/<gateway-name> -f
Controller logs
The agentgateway controller tracks a log level per component, such as the translator, syncer, and gateway controller.
Show the controller’s current log level for each component. The
-nflag defaults toagentgateway-system.agctl controller log -n agentgateway-systemExample output (truncated):
current log levels:
---
agentgateway/syncer: info
agentgateway/translator: info
gateway-controller: info
deployer: info
default: info
Set the log level. Change all components at once with
--level, or target a single component with--set component=level.# Set all components to debug agctl controller log -n agentgateway-system --level debug # Set a single component to debug agctl controller log -n agentgateway-system --set agentgateway/syncer=debugTail the controller logs.
kubectl logs -n agentgateway-system deploy/agentgateway -f
Note
You can also get and set the proxy log level directly through the /logging admin endpoint, such as curl -X POST "http://localhost:15000/logging?level=debug" after you port-forward to the proxy pod. The endpoint accepts the same RUST_LOG filter syntax for fine-grained, per-module levels, such as info,proxy::httpproxy=trace.
Capture profiles
Agentgateway includes pprof endpoints to help you investigate CPU and memory issues. Use the agctl proxy profile commands to capture a profile. agctl resolves the proxy pod, opens the port-forward, reads the admin endpoint, and writes the profile to a file, so you do not need to manage kubectl port-forward yourself.
Optional: If you have not already, download Graphviz to visualize the profiles.
Capture a CPU profile. The default duration is 30 seconds. Send traffic through the gateway while the profile runs. Otherwise, the profile contains no samples.
agctl proxy profile cpu gateway/<gateway-name> -n <namespace> --seconds 30 -o ./cpu.pprofExample output:
Wrote cpu profile to ./cpu.pprofCapture a heap profile.
agctl proxy profile heap gateway/<gateway-name> -n <namespace> -o ./heap.pprofExample output:
Wrote heap profile to ./heap.pprofIf you omit
-o,agctlwrites the profile toagentgateway-cpu-<timestamp>.pb.gzoragentgateway-heap-<timestamp>.pb.gzin the current directory.Inspect the profiles with
go tool pprof.CPU profile
go tool pprof -http=: cpu.pprofHeap profile
go tool pprof -http=: heap.pprofGraphviz opens on your web browser to a UI on localhost. Example:
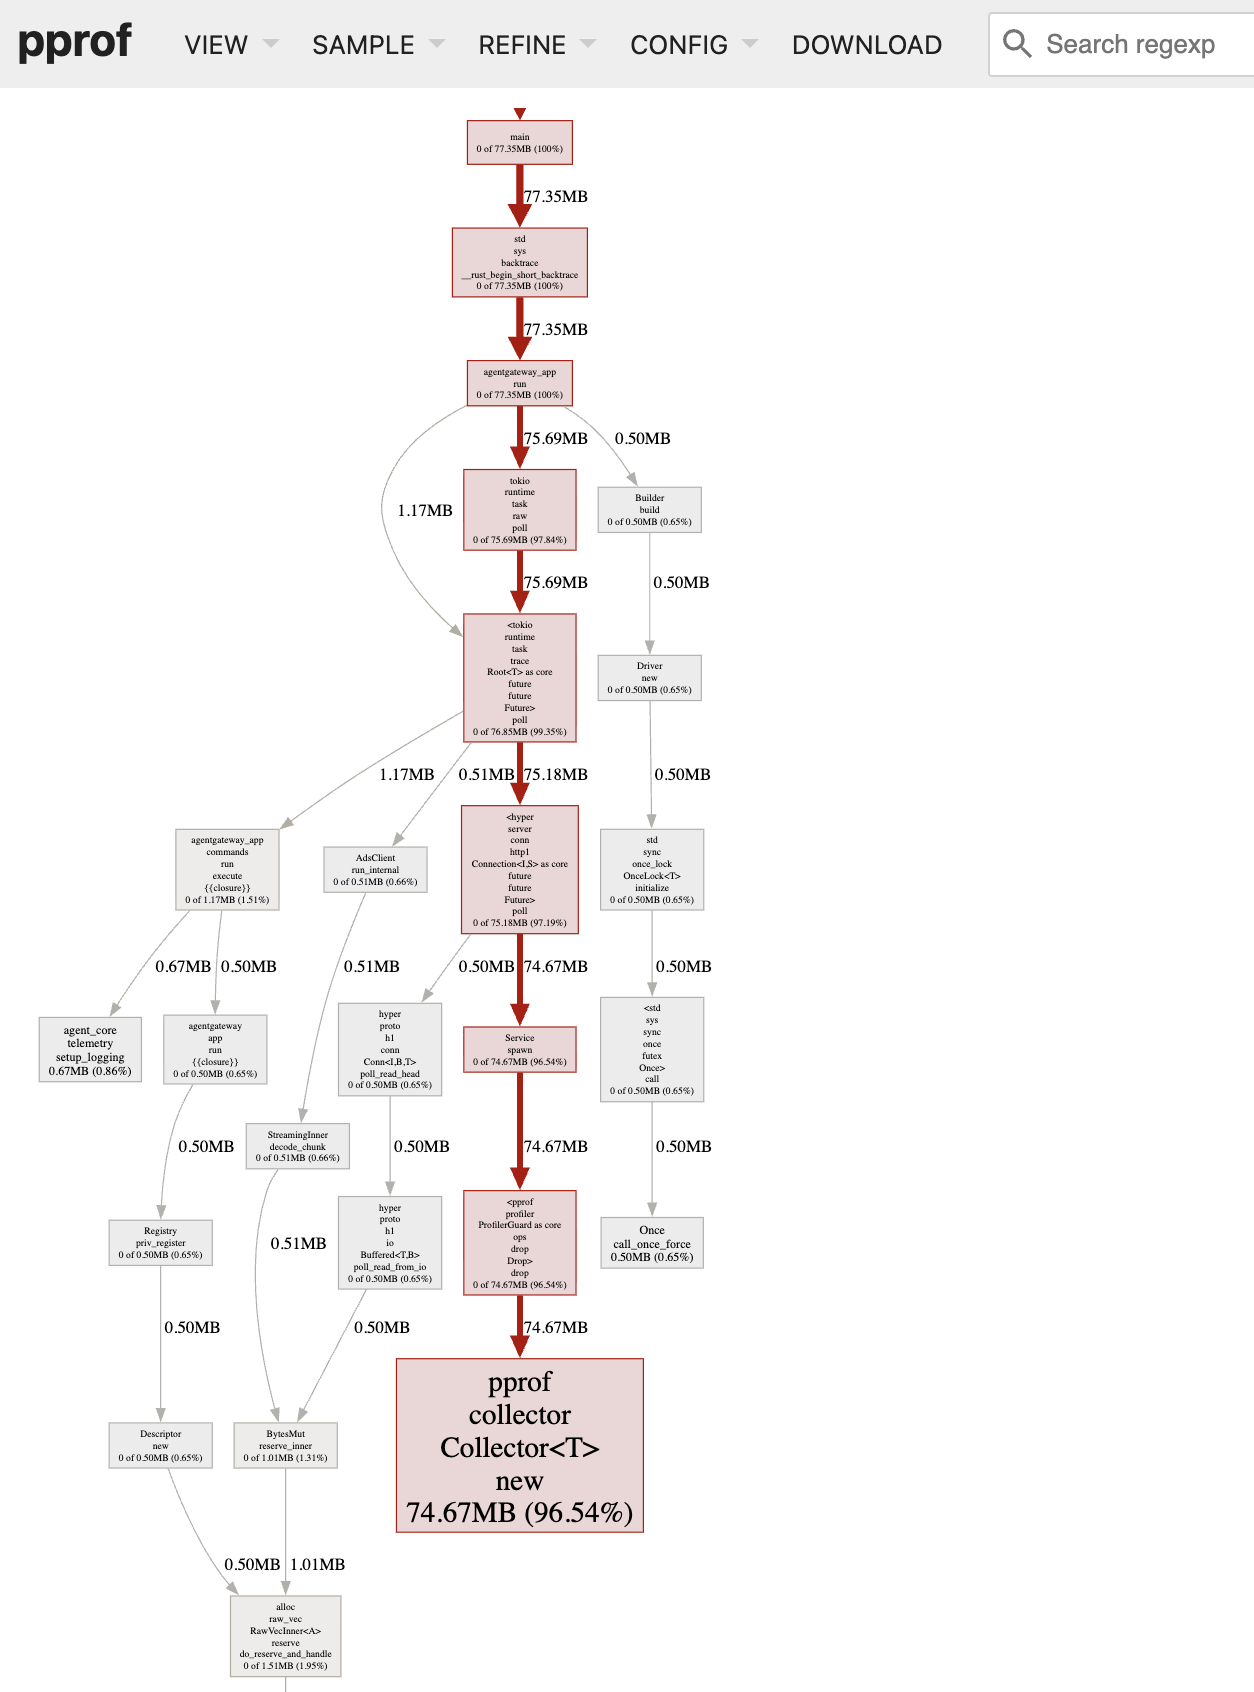
Heap profile graph Heap profile graph
Note
To profile an agentgateway binary that runs on your workstation instead of a proxy pod, use --local, such as agctl proxy profile heap --local. Note that profiling data is available only when agentgateway runs on Linux. Proxy pods always meet this requirement, but a local macOS or Windows build does not: the CPU profile endpoint is not registered, so agctl proxy profile cpu fails with a 404 Not Found error, and agctl proxy profile heap writes a profile that contains no allocation samples.